
The Revenue Success Program
A phased program to quantify your Churn Tax and your Expansion Gap, then deliver the operating model to reverse both.
We sell a financial outcome

Every company we work with starts in the same place: churn costs more than leadership thinks, expansion runs below benchmark, and nobody has quantified either number or built the investment case to fix them. Our engagements solve that in sequence.
Fixed scope. Fixed fee. Outcome-driven. No hourly billing.
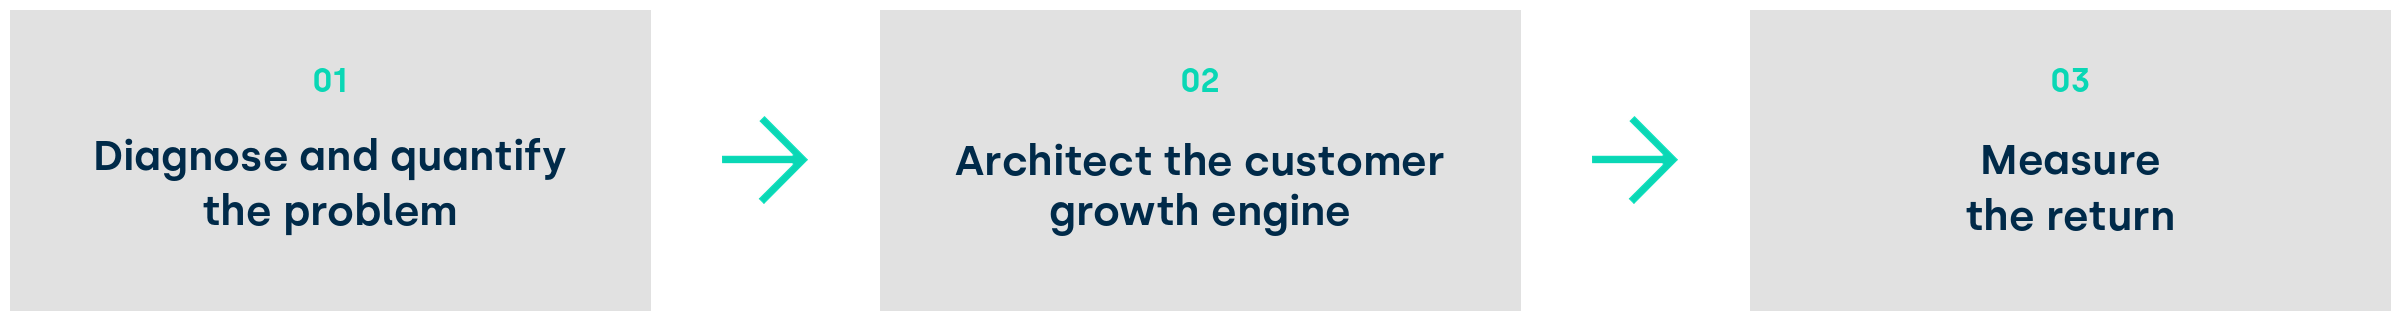
PHASE 1: REVENUE SUCCESS DIAGNOSTIC
Quantify the Churn Tax and the Expansion Gap. Audit maturity. Build the investment case
Duration: 4 to 6 weeks
We start by calculating your two numbers:
The Churn Tax across its three layers: revenue that did not renew, expansion forfeited on churned accounts, and the sales and marketing dollars required to replace the lost base.
The Expansion Gap against your segment benchmark: the expansion revenue your installed base should produce and doesn't. From there we audit how the organization operates, where investment is missing, and what the recovery is worth.
What you walk away with:
The two numbers
Churn Tax analysis: economic cost quantification across direct revenue loss, forfeited expansion, and replacement CAC, with 3-year compounding.
Expansion Gap analysis: your expansion mix benchmarked to segment, the gap quantified in annual revenue, and the readiness signals behind it.
Data insights: investment gaps, retention and expansion motion, and decision blind spots.
THE OPERATING AUDIT
CS Maturity Assessment: audit across 7 dimensions and 110+ elements with gap analysis and a 5-stage rating from Emergent to Transformative.
AI maturity and readiness: AI adoption, data foundations, and agentic automation potential across the function.
Enablement readiness scorecard across infrastructure, execution, and people, with priority actions.
Opportunities, priorities, and sequencing: top priorities ranked by revenue impact with effort ratings and quick wins.
The Investment Case
Recovery and growth projections: a phased 3-year model with conservative and realistic scenarios.
Investment model: phased trajectory with category allocation across people, process, and technology.
Next steps: decisions required and the recommended path into the Growth Blueprint.
PHASE 2: GROWTH BLUEPRINT
Architect the customer growth engine, and the investment case to fund it.
Duration: 4 to 8 weeks
Once we quantify the problem, we design the fix and the funding ask together. Phase 2 delivers growth targets by year, the investment envelope phased across people, AI agents, and operating infrastructure, and the human + agent operating model your team executes against. It leaves the room as a board-ready approval package, with the 12-month scorecard your governance will run on.
This is the operational blueprint your team executes against.
What you walk away with:
The INVESTMENT CASE
Growth targets by year: recovered churn and expansion lift modeled over 3 years, conservative and realistic scenarios.
Total addressable revenue model with expansion potential mapped account by account.
Investment envelope: phased allocation across human capital, agentic capital, and operating infrastructure, with quarterly cash flow.
Board-ready approval and funding asks tied to the critical path..
THE OPERATING MODEL
Human + agent operating model: capacity ratios, account segmentation, org design, and hiring sequence.
Retention and expansion motion with customer readiness gates, so teams engage accounts primed to grow at the right time.
Lifecycle map and value pathways with time-to-value definitions and gates.
Stage-specific playbook library with AI-augmented triggers, agent deployment sequence, and human-in-the-loop escalation rules.
Compensation and incentive architecture aligned to retention and expansion.
The EXECUTION system
12-month implementation scorecard with quarterly milestones and owners.
Leading and lagging indicator structure with forecasting model.
Governance cadence with decision rights, cross-functional accountability map, and AI governance framework.
Risk register with mitigations, plus 30/60/90 quick wins.
PHASE 3: OVERSIGHT AND CALIBRATION
Track NRR. Calibrate against the scorecard.
Duration: monthly & quarterly
We don't hand over a deck and disappear. Phase 3 is ongoing oversight where we hold the line on execution and keep the model honest.
Monthly calibration calls run against scorecard milestones. Quarterly reviews measure retention, expansion, and NRR progress against the targets set in the Diagnostic.
This is where the engagement shifts from advisory to accountability. We architect, measure, and hold the standard. You execute and improve.
THE OPERATING CADENCE
Monthly calibration calls against scorecard milestones.
Quarterly progress reviews: retention, expansion, and NRR measured against Diagnostic targets.
Course corrections when execution drifts, and recalibration when assumptions meet reality, market shifts, account surprises, levers that underdeliver.
THE OUTCOME REVIEW
12 or 18-month outcome review measuring delivered results against the baseline.
Success fee tied to measured NRR improvement.
Our success fee pays on NRR improvement.
We get paid when your customer revenue grows.
WHO THIS IS FOR
CEOs
making the board case
You need the financial argument for running customer growth as a company-wide operating priority, and a model your whole leadership team commits to.
CFOs
approving the spend
You need the investment case quantified, the ROI modeled, and the funding ask phased before approving headcount, AI, and tooling spend.
PE Operating Partners
underwriting NRR upside
You need post-sale revenue risk and expansion upside quantified in a portfolio company, with a blueprint the management team owns.
CROs & CCOs
owning the number
You own NRR while the levers sit across Sales, Marketing, Product, and Customer Success. You need executive buy-in and the roadmap to get it.
Frameworks built across $350M-$1B in CCO P&L responsibility. 95%+ GRR, 115%+ NRR at scale.
KEY METRICS
1.5-2.5x
True cost of churn relative to reported ARR loss
40%+
Share of new ARR top performers source from existing customers
3x+
ROI on a mature customer growth investment by Year 3
120%+
NRR Benchmark for top-quartile SaaS